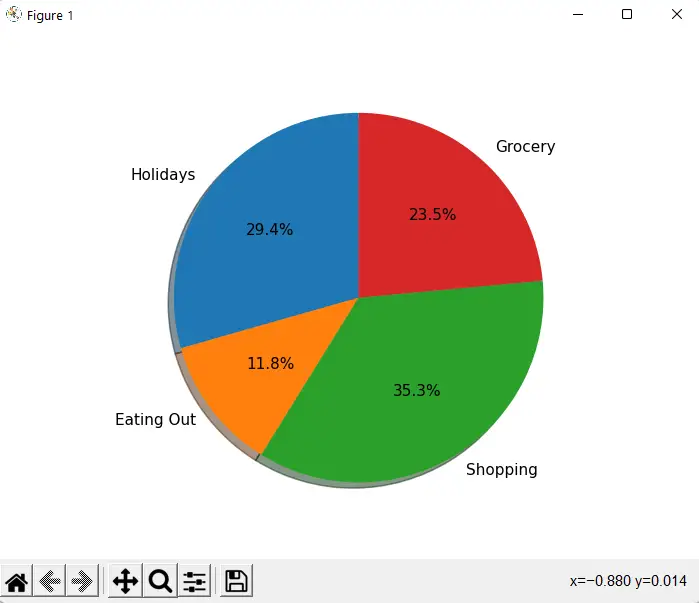
Python program to create pie chart of monthly expenses with percentage
In this tutorial, we are going to show and explain the Python program to create pie chart of monthly expenses with percentage. We have added the video tutorial and the source code of the program.
So let us begin with the Python program to create pie chart of monthly expenses with percentage.
Video Tutorial: Python program to create pie chart of monthly expenses with percentage.
Source Code:
import matplotlib.pyplot as plt
Partition = 'Holidays', 'Eating Out', 'Shopping', 'Grocery'
sizes = [250, 100, 300, 200]
figl, ax1 = plt.subplots()
ax1.pie(sizes, labels=Partition, autopct='%1.1f%%', shadow=True, startangle=90)
ax1. axis('equal')
plt.show()
Output:


